Generate ERD
ekai generates an Entity Relationship Diagram with AI-detected primary and foreign keys using multi-signal analysis from statistical profiling and onboarding context.
Complete the Statistical Profiling step to analyze your data patterns.
Starting ERD Generation
Click Go To Schema Generation or navigate to the SCHEMA tab to start:
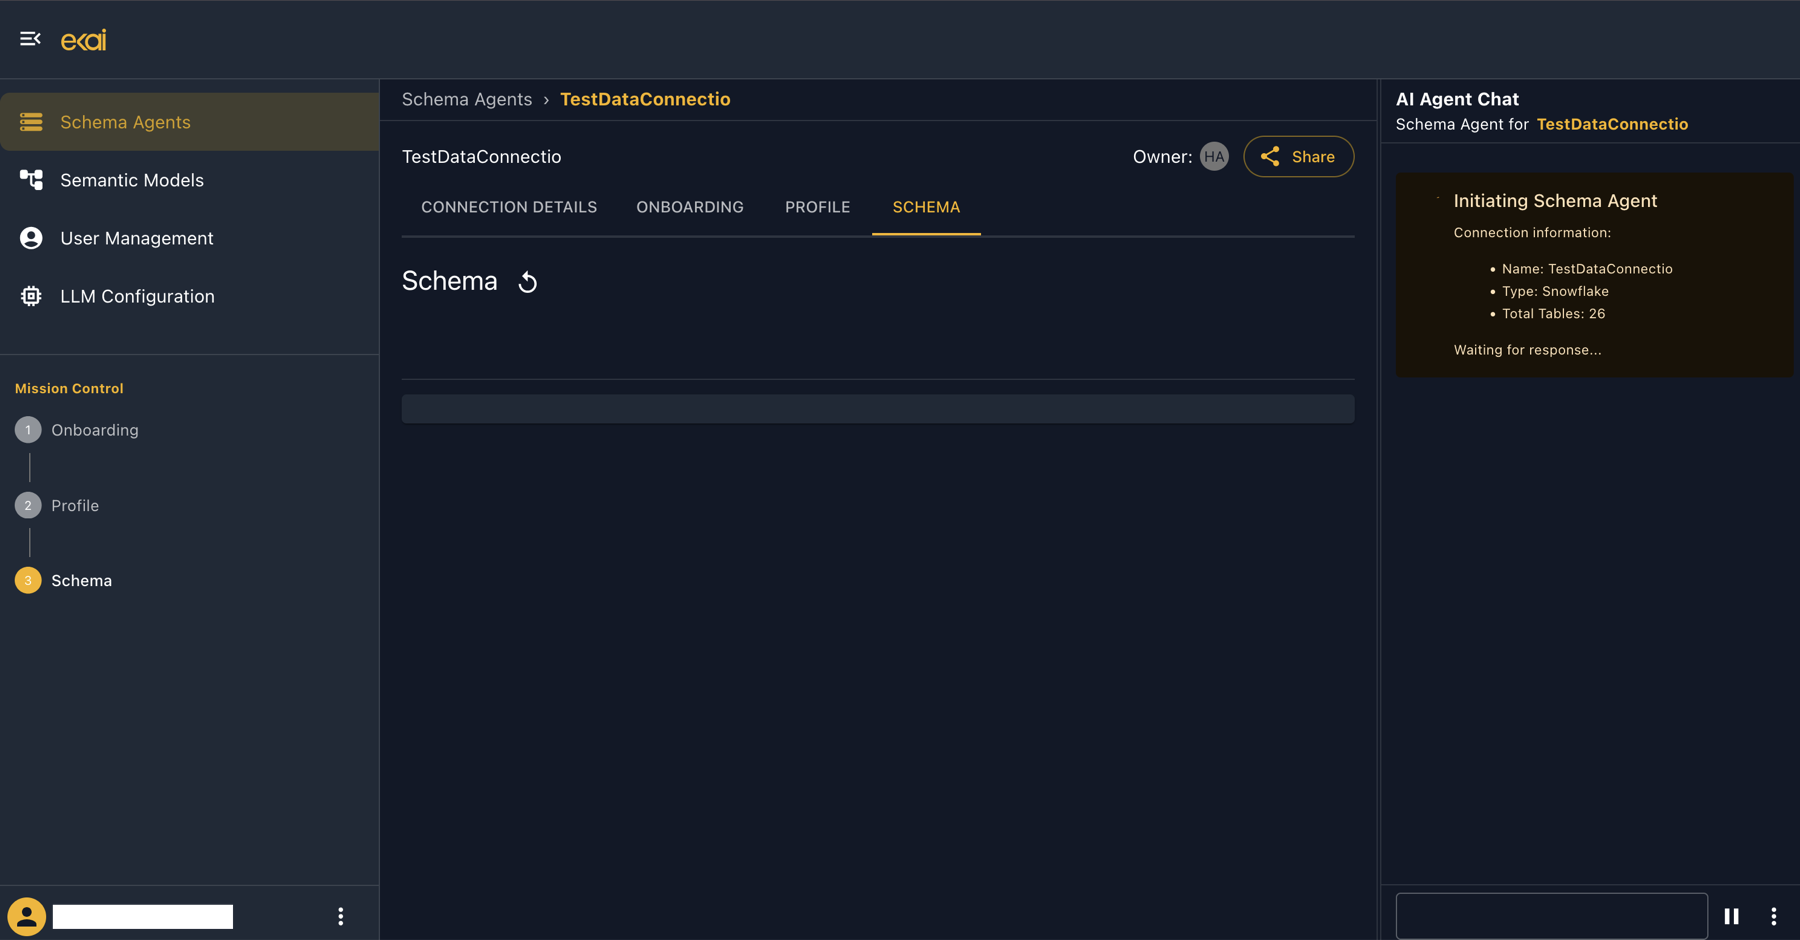
The AI Agent initiates schema analysis with connection information:
- Connection name and type
- Total number of tables
- Processing status
Generation Progress
Watch the AI work through your schema:
Progress Steps
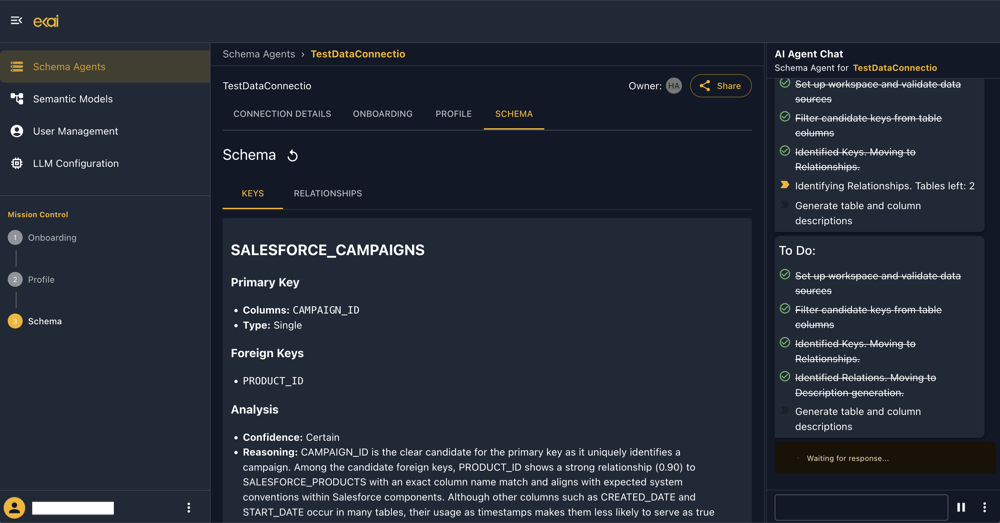
The AI Agent Chat shows real-time progress:
To Do:
Set up workspace and validate data sources✓Filter candidate keys from table columns✓Identified Keys. Moving to Relationships✓- Identifying Relationships. Tables left: 2
- Generate table and column descriptions
Key Detection Results
For each table, the SCHEMA tab displays detected keys:
Keys Tab
| Field | Description |
|---|---|
| Primary Key | Detected primary key column(s) |
| Type | Single or Composite |
| Foreign Keys | Detected FK columns |
| Confidence | Certain, High, Medium, Low |
| Reasoning | AI explanation for the detection |
Example Detection
Table: SALESFORCE_CAMPAIGNS
─────────────────────────────
Primary Key:
  • Columns: CAMPAIGN_ID
  • Type: Single
  • Confidence: Certain

Foreign Keys:
  • PRODUCT_ID → SALESFORCE_PRODUCTS.PRODUCT_ID

Analysis:
  "CAMPAIGN_ID is the clear candidate for the primary key as it
  uniquely identifies a campaign. PRODUCT_ID shows a strong
  relationship (0.90) to SALESFORCE_PRODUCTS with an exact
  column name match."
ERD Complete - DBML View
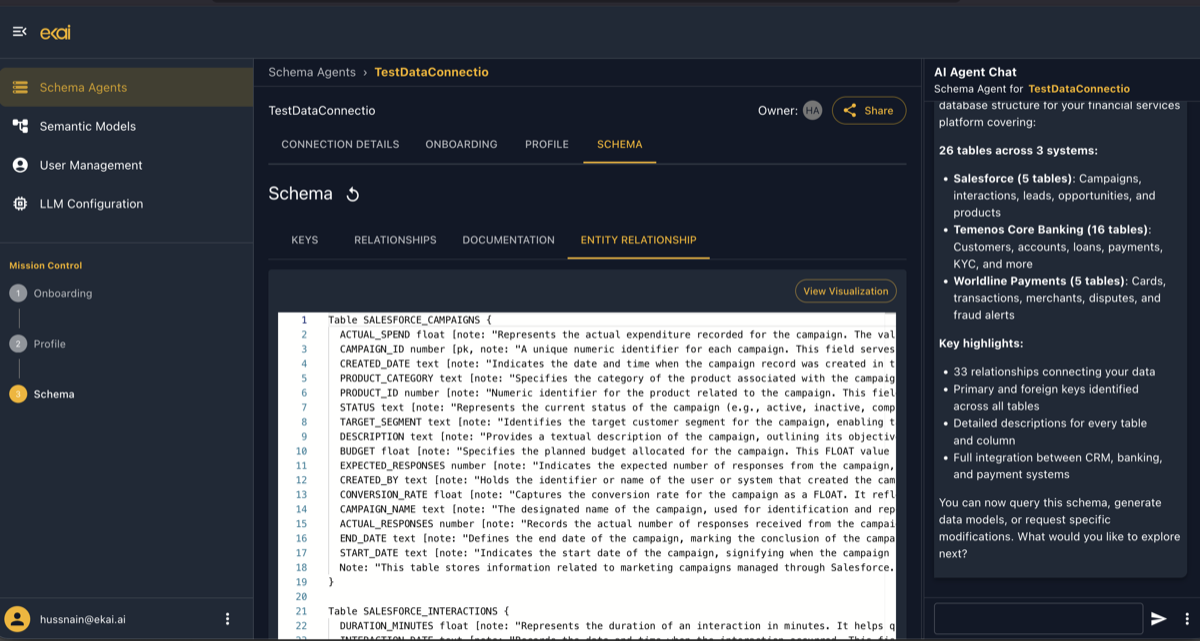
When generation completes, view the ERD in DBML (Database Markup Language) format:
DBML Output
Table SALESFORCE_CAMPAIGNS {
  ACTUAL_SPEND float [note: "Actual expenditure for the campaign"]
  CAMPAIGN_ID number [pk, note: "Unique identifier for each campaign"]
  CREATED_DATE text [note: "When the campaign was created"]
  PRODUCT_ID number [note: "Related product identifier"]
  STATUS text [note: "Campaign status (active, inactive, completed)"]
  // ... more columns

  Note: "Marketing campaigns managed through Salesforce"
}

Table SALESFORCE_PRODUCTS {
  PRODUCT_ID number [pk]
  PRODUCT_NAME text
  // ... more columns
}

Ref: SALESFORCE_CAMPAIGNS.PRODUCT_ID > SALESFORCE_PRODUCTS.PRODUCT_ID
SCHEMA Sub-tabs
| Tab | Content |
|---|---|
| KEYS | Primary and foreign key analysis per table |
| RELATIONSHIPS | All detected relationships |
| DOCUMENTATION | Generated table/column descriptions |
| ENTITY RELATIONSHIP | DBML code view |
Visual ERD Diagram
Click View Visualization to see the interactive ERD:
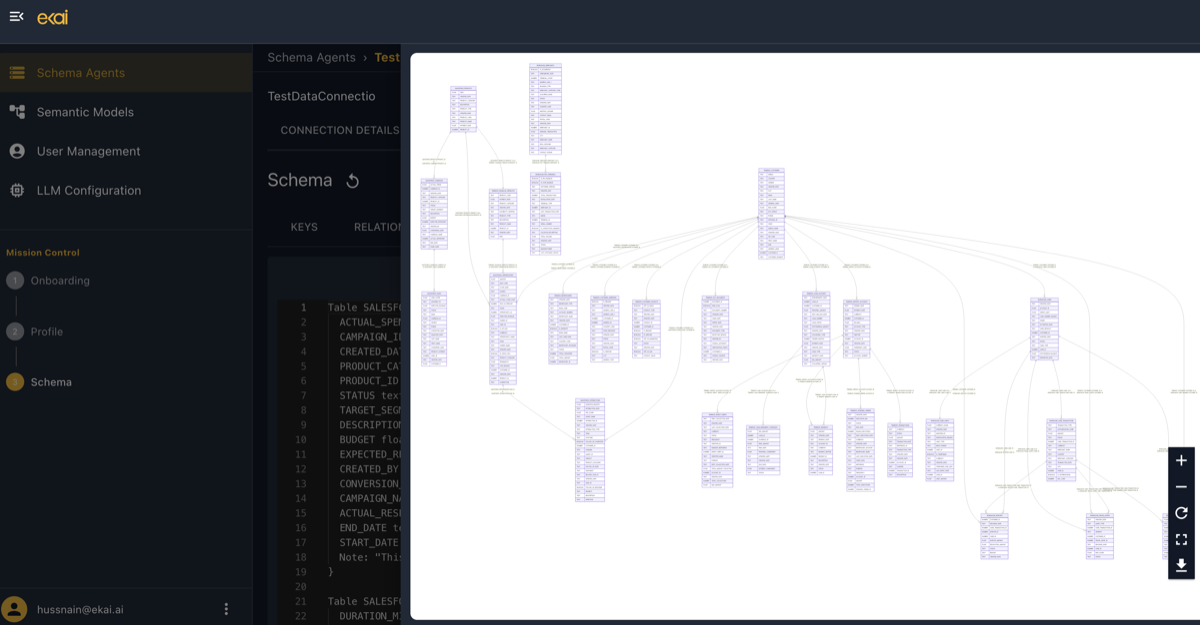
Diagram Features
- Zoom in/out
- Pan to navigate
- Click tables for details
- Table name header
- Column names listed
- PK indicator
- FK connections
- Cardinality indicators
- Click for details
- + / - zoom
- Fullscreen mode
- Download image
Generation Summary
The AI Agent provides a summary of what was generated:
Database structure for your financial services platform:
26 tables across 3 systems:
- Salesforce (5 tables): Campaigns, interactions, leads, opportunities, products
- Temenos Core Banking (16 tables): Customers, accounts, loans, payments, KYC
- Worldline Payments (5 tables): Cards, transactions, merchants, disputes, fraud alerts
Key highlights:
- 33 relationships connecting your data
- Primary and foreign keys identified across all tables
- Detailed descriptions for every table and column
- Full integration between CRM, banking, and payment systems
Next Steps
- Review Relationships — Refine ERD with AI chat
- Semantic Models Overview — Use ERD to build data products